Bias and Fairness Part 2: Measuring Fairness in Machine Learning

This is the second part of our ‘Bias and Fairness in Data and Machine Learning’ blogpost series. For an informative overview sprinkled with indignation-triggering anecdotes on bias in data and machine learning (ML), check out our previous blog ‘Bias in Data and Machine Learning‘.
So, let’s say your social conscience and technical consciousness have converged on the cause of fighting against unjust bias in order to create a fairer world through machine learning – in other words, you are ready to get into the technicalities of fairness ML – this blog post is here to address your next questions: how is fairness defined and quantified in ML[1]?
Whilst the concept of ‘fairness’ is inherently philosophical and can be very fluid, in the context of fairness in ML, it (slightly) narrows down to ensuring an ML algorithm treats people equally, regardless of certain demographics characteristics (termed ‘protected attributes’) such as gender and race, which are unethical or illegal to discriminate on for the use case at hand.
A few considerations to complicate this definition:
1. There is a need to explicitly state the protected attributes against which you would test your model and, whenever possible, the privileged vs underprivileged values for the protected attributes. This requires formulating educated hypotheses of who are at risk of being disadvantaged and outlining clear agendas of who you want to protect from unfair algorithmic judgment. Therefore, to audit a CV sifting model deployed in a hiring process goes beyond tracing its apparently meritocratic input features. By flagging gender as a potential discriminating factor and declaring it a protected attribute, for example, you will be specifying the dimension along which to measure fairness: in other words, it is the first step.
2. ‘Regardless of’ might read ‘unawareness'[2] implying the removal of the protected features from the model would satisfy a certain ‘fairness through unawareness’. It is usually a good starting point but known to be insufficient. Some more-innocent looking included features (or combinations of them) could effectively act as predictors for the excluded, protected features. For example, due to historic residential segregation policies in many U.S. cities, racial information is often spelled out in one’s postcode. Compounded with legacies of redlining practices, even neighborhood characteristics such as green space or liquor stores per capita can be heavily correlated with race in some areas too.
Various explainability AI (XAI) techniques can be of help here: for our opinions on how to conduct purposeful XAI effectively, check out our video series on how to get started. Due to its ad-hoc, exploratory nature, the discovery and removal for leakage of protected features is inherently an iterative process, calling for frequent reviews and updates on the formulated hypotheses, as well as ongoing monitoring of fairness with every model iteration and as underlying distribution in data drifts over time. This example[3] of the 6 iterations of removing biases in Jigsaw’s toxic text detection model demonstrates this very challenge and features a Google Cloud’s Model Card tool they have used to enable the process.
3. Definition of ‘treating equally’ is specific to the use case and objective. In the example of defining fairness in a predictive bail granting algorithm, one could ask ‘What are your chances of being wrongly denied bail just given your race?’, ‘Among people denied bail, what are the chances you’re innocent given your race?’, or ‘Among people who should be granted bail, what are the chances you were denied bail given your race?’, resulting in subsequently different formal definitions P(Y= 1, Y = 0 | R ), P(Y = 0 | R, Y = 1 ), and P( Y = 1 | R, Y = 0 ), respectively[4]. Note that Y= 1 indicates predicted guilt hence a bail denial, Y = 0 notates factual innocence thus when a bail should be granted, and R refers to the protected attribute race. In fact, a survey paper summarised 10 definitions of fairness. To choose among them requires scoping out the intention of protection and level of guarantee, then creating and validating the specific questions, and lastly translating these into statistical metrics.
4. The motivation behind fairness ML is to ensure equal algorithmic treatment without unjust discrimination based on personal characteristics of those on the receiving end. That latter part may sound at odds with personalisation, one of the most popular ML use cases. Indeed, this paradox underlies the accuracy-fairness tradeoff behind many persisting dilemmas and challenges facing those wanting to practice fair ML.
After all, the task of classification is to discriminate (i.e. distinguish). However, though the mathematical contraption that innocuously discriminates cats from dogs largely resembles the ML models that identify human faces, the gravity of consequences of an unfair model clearly varies. In other words, when a use case itself is further removed from ethical sensitivity, whatever input feature that maximises prediction accuracy is fair play, a freedom rarely enjoyed by those crafting ML models concerning humans. For example, race and gender may be predictive – in terms of statistical association, not causation – of an applicant’s likelihood to thrive for a job post. To discard these features holding predictive power will inevitably reduce the model’s performance if everything else stays the same, a price one should be ready to pay and come up with compensating alternatives such as collecting more and better data.
5. The prediction label itself may contain unjust biases already, as they are merely data points that capture existing social processes of the world we live in – far from perfect as we know it! For example, one may argue that historical hiring decisions may not have been completely fair. Therefore, an ML algorithm trained to approximate and automate this human judgment has little hope of escaping such biases without explicit intervention at the time of modeling, which introduces another set of arguably benign biases itself. Despite the subjective sound of it, however, it is definitely a worthy endeavor! This ‘opinionated righteousness’ can be encoded in an ML model in many ways, via re-sampling and re-weighting to compensate uneven label distributions for different demographics in the training set for example.
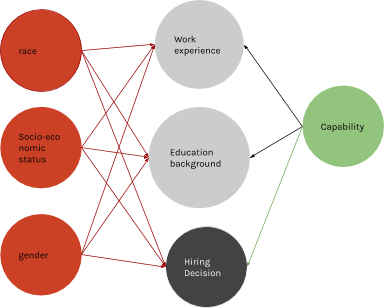
One perhaps less obvious way of doing so is by drawing causal diagrams, a tool utilised in a fairness ML approach called counterfactual fairness[5]. The diagram below illustrates the causality relations (arrows) between the various factors (nodes) in a hiring process. For example, the right half of the graph shows that a candidate’s capability would have had an impact on their work experience, education background – and rightfully so (hence marked in green) – would do their final hiring decision. The red nodes (race, socio-economic status, and gender) signify protected attributes which shouldn’t have an influence on the hiring decision but unfortunately are believed to have done so in the past. Exactly how these undesirable biases trickled into the data, as input features or target label, is denoted as the red arrows – as judged by the model maker. In other words, when drawing up a causal diagram, you express what you think how the world did, should have, and should work(ed), in the sense of what happened as a result of what. Intuitively, to measure counterfactual fairness then is to check deviations between the should-haves and reality. A decision is counterfactually fair towards an individual (as defined by ‘capability’) if it would remain the same in a counterfactual world where the individual belonged to a different demographic group[6].
Measuring fairness in machine learning has its complications and caveats – as does any study on human welfare or attempt to measure the immeasurables. Hope this blog post helps you make the first steps towards fairness ML concrete and considerate!
________________________
[1] Note that while fairness in other data applications such as data visualisation is not the focus of this blogpost, it is no less important.
[2] Mehrabi, N., Morstatter, F., Saxena, N., Lerman, K., and Galstyan, A., “A Survey on Bias and Fairness in Machine Learning”, <i>arXiv e-prints</i>, 2019. page 11.
[3] Fairness in Perspective API, Google
[4] The example given here was taken from the fairness tree diagram provided by Aequitas, an open source bias audit toolkit developed at Center for Data Science and Public Policy at the University of Chicago.
[5] We took great learning and inspiration from the ‘Counterfactual Fairness’ Lecture by Matt Kusner
[6] Mehrabi, N., Morstatter, F., Saxena, N., Lerman, K., and Galstyan, A., “A Survey on Bias and Fairness in Machine Learning”, <i>arXiv e-prints</i>, 2019. page 12.