Tracking Business KPIs with Looker
Author: Holly Pickering, Senior Data Consultant
Many businesses need to be able to see how they’re pacing against their monthly goals but don’t have a quick way to put this into action. This can be for many reasons; perhaps, they’re impacted by a lack of product or regional-level granularity, making it difficult to integrate high-level targets into the BI Tool. Maybe they’re an e-commerce business that is just getting off the ground, in which case, tracking high-level revenue, order volume and new customer KPIs for the year is sufficient for their needs.
The solution?
Enter table calculations! An easy-to-implement approach that provides business users, with access to track and amend goals (as frequently or infrequently as needed) using any explore within the Looker instance to enable real-time tracking of company KPIs.
In this blog, we will review a step-by-step process of how we can leverage table calculations in Looker to create an easy way to manage targets, assess progress to target overall and create a run-rate view for a clear understanding of how your company is pacing to target day by day.
Step 1: Set up your base explore
Let’s assume for the sake of simplicity that it is the beginning of January and you’re looking to set goals for the calendar year. Tracking by fiscal year is of course entirely possible when your date dimension_groups contain a fiscal year dimension that is used by setting a fiscal_month_offset in your model file.
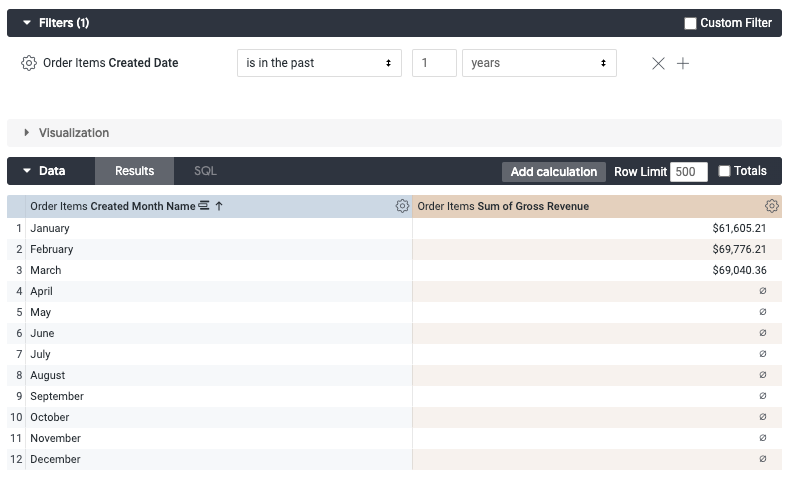
We’ll start by navigating to an explore that will contain your revenue or sales data for monthly tracking. Let’s go ahead and add a date filter for the current year and our created_month_name along with your sales metrics (revenue, orders, customers, etc) into the query. In this example, we’ll use our created_date along with our sum_of_gross_revenue.
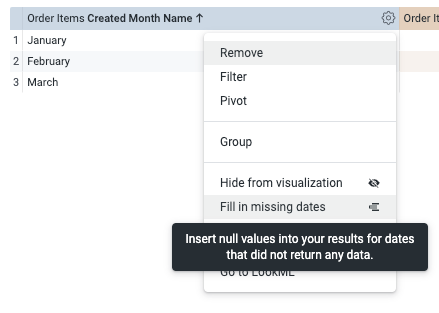
Given that we’re setting up a query that will serve us for the year, let’s select the cogwheel over the created_date dimension to access the settings and select ‘fill in missing dates’ to ensure we have all future months for the year returned:
Your base will look something like this:
Step 2: Create table calculation for monthly targets
Now that we have our base, let’s go ahead and begin creating our series of table calculations that will enable us to track our targets.
First off, we’ll create a Revenue Targets calculation that will be the foundation of our pacing. Leveraging IF statements in Looker is our best approach to do this and enables us to load a year’s worth of targets at once. An example of this would break down as follows:
if(${order_items.created_month_name} = "January",60000,
if(${order_items.created_month_name} = "February",62000,
if(${order_items.created_month_name} = "March",80000,
if(${order_items.created_month_name} = "April",85000,
if(${order_items.created_month_name} = "May",87500,
if(${order_items.created_month_name} = "June",90000,
if(${order_items.created_month_name} = "July",92500,
if(${order_items.created_month_name} = "August",95000,
if(${order_items.created_month_name} = "September",96000,
if(${order_items.created_month_name} = "October",97500,
if(${order_items.created_month_name} = "November",98000,
if(${order_items.created_month_name} = "December",100000,null


))))))))))))
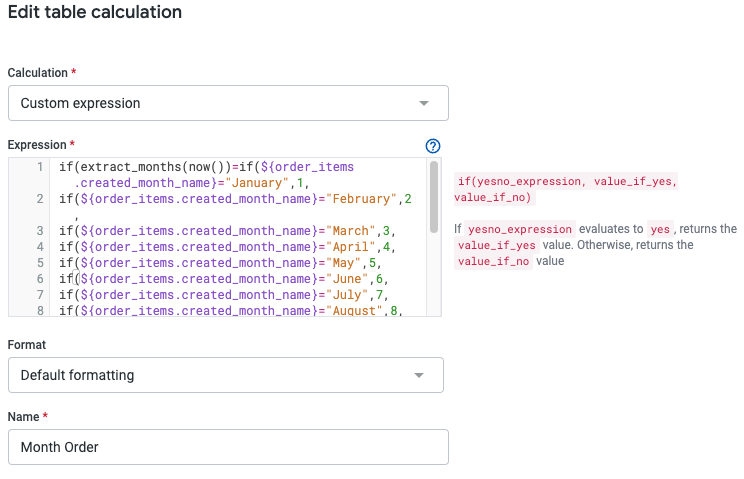
Remember to add the value_if_no (generally defaulting to a zero or null), along with the correct number of closing brackets required to complete the expression and avoid the calculation returning an error. Go ahead and save that once we’ve arrived at a table calc that is error-free:
if(${order_items.created_month_name} = "January",31,
if(${order_items.created_month_name} = "February",28,
if(${order_items.created_month_name} = "March",31,
if(${order_items.created_month_name} = "April",30,
if(${order_items.created_month_name} = "May",31,
if(${order_items.created_month_name} = "June",30,
if(${order_items.created_month_name} = "July",31,
if(${order_items.created_month_name} = "August",31,
if(${order_items.created_month_name} = "September",30,
if(${order_items.created_month_name} = "October",31,
if(${order_items.created_month_name} = "November",30,
if(${order_items.created_month_name} = "December",31,null


))))))))))))
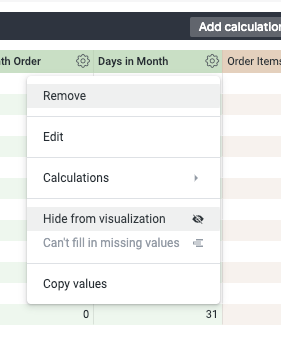
You won’t need to display the Month Order or Days in Month within your final Look so go ahead and use the cogwheel to ‘Hide from visualization’:
if(extract_months(now()) =
if(${order_items.created_month_name} = "January",1,
if(${order_items.created_month_name} = "February",2,
if(${order_items.created_month_name} = "March",3,
if(${order_items.created_month_name} = "April",4,
if(${order_items.created_month_name} = "May",5,
if(${order_items.created_month_name} = "June",6,
if(${order_items.created_month_name} = "July",7,
if(${order_items.created_month_name} = "August",8,
if(${order_items.created_month_name} = "September",9,
if(${order_items.created_month_name} = "October",10,
if(${order_items.created_month_name} = "November",11,
if(${order_items.created_month_name} = "December",12,

null)))))))))))),1,0)
Excellent! Now we’ve created the foundation of our tracking-to-target look and can proceed to add in the calculations that will be necessary for the run-rate or monthly tracking view.
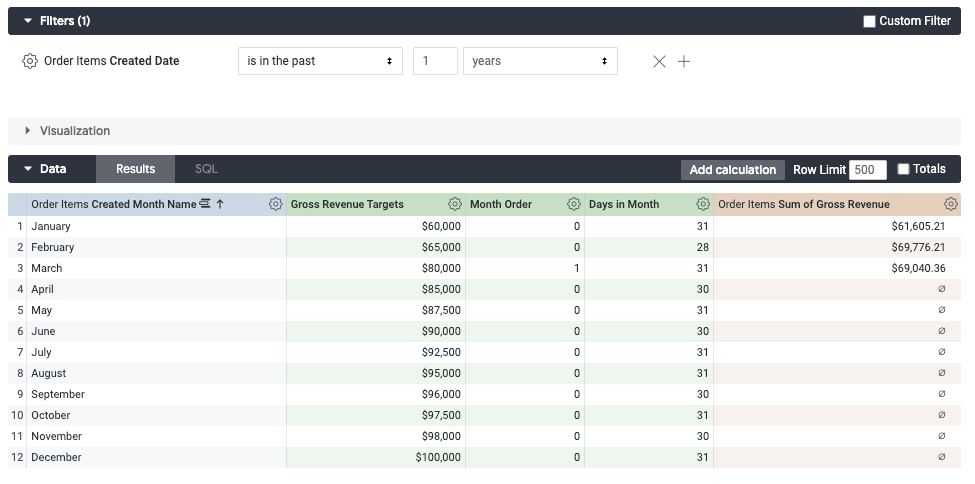
Step 3: Add calculations for % to target & run-rate % to target tracking
Our first percentage tracking calculation will reflect our revenue to target for the month in full so let’s go ahead and divide our sum_of_gross_revenue by the Gross Revenue Target. Don’t forget to update your value format to reflect a percentage with your preferred decimal places:
The next step requires two parts. You could integrate these two calculations into one using a nested IF statement approach, but we’ll take the long route here for transparency on the process.
For part one, let’s go ahead and calculate the run-rate target based on a) the total number of days in a month, b) the monthly target and c) the current day of the month BUT let’s also ensure we’re only returning a run rate when we’re in the current month (as this isn’t entirely relevant to us for months that have elapsed or are in future):
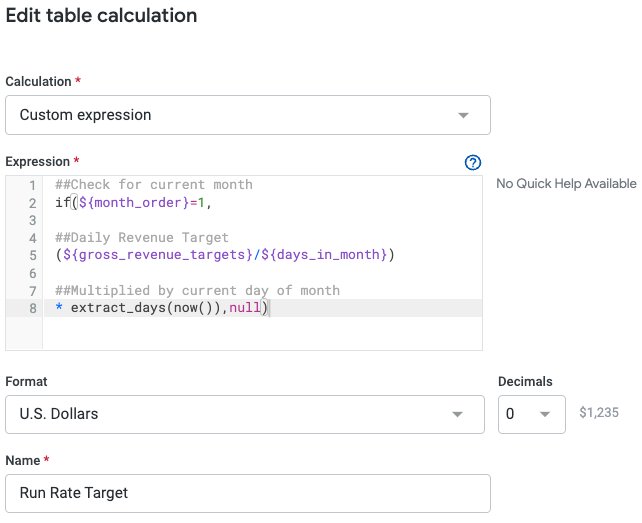
To break that down — first, we’ll leverage our Month Order calculation to confirm results are returned only for the current month. Once that has evaluated to true, we calculate a daily target (dividing the full month target by the Days in Month calculation) and then finally multiply that daily amount by the current day of the month for our run rate.
Here’s a great time to mention that you can amend this approach depending on the needs of your company. Perhaps you only want to track revenue as of the last complete day, knowing you are only likely to approach that 100% marker as the business day wraps up. You could go ahead and amend the final part of the calculation to extract_days(add_days(-1, now())) in order to return the prior day of the month value. When used in conjunction with an exclude_today dimension that you‘ve built in LookML, you’ll be able to display gross revenue pacing that is strictly based on complete days in case that was more relevant for your purposes.
If you wanted to get more granular with it, you could create an hourly run rate instead of a daily metric to see how the business is pacing hour by hour. Minute by minute?! The options are limitless!
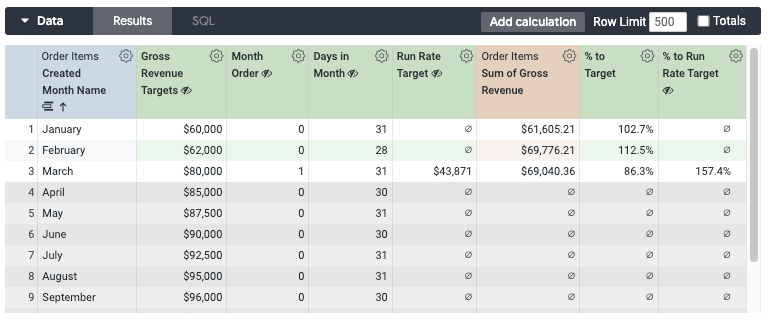
Before we get too carried away, let’s recap where we’re at! We’ve added our % to Target and calculated the Run Rate Target:
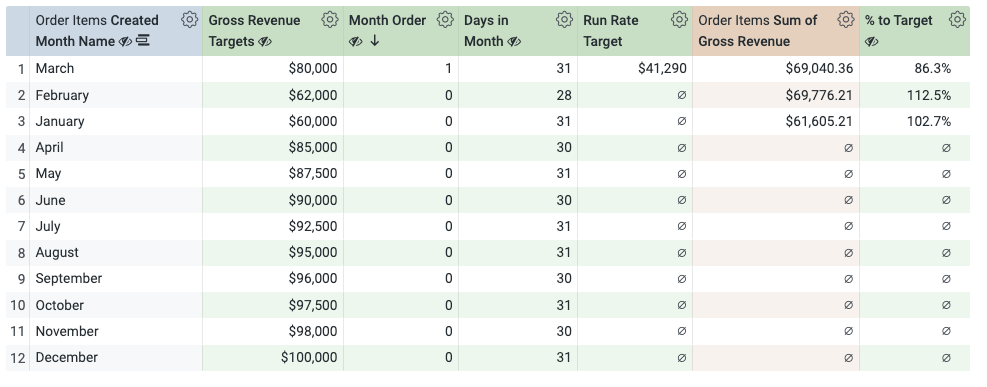
Now moving on to part two, we’ll add one final table calculation for the % to Run Rate Target figure, remembering to update your value format to Percent:
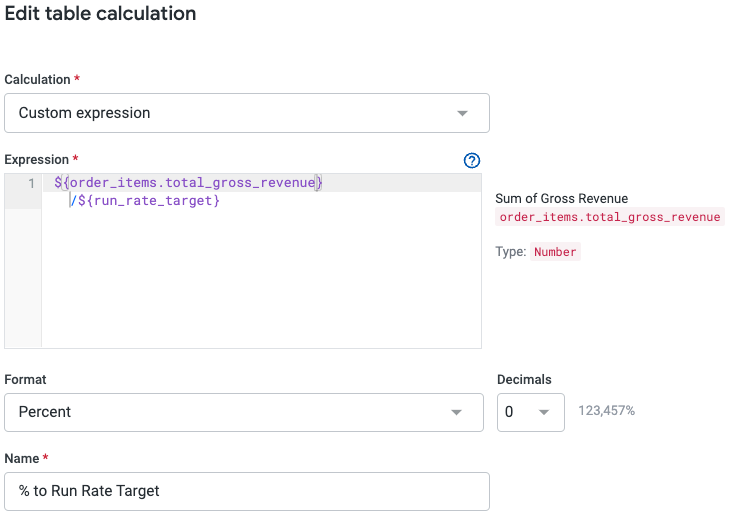
Let’s save this query as a Look and there you have it — the heavy lifting is complete! While this base query was a bit involved for us to put together, we’ve created table calculations that are dependent on dynamic logic that will automatically update with each passing month, requiring no manual intervention to maintain. With all calculations pointing back to our Gross Revenue Targets, we can easily update this look as often as is necessary — dictated by quarterly forecasts or annual reviews — by simply updating the IF statements in that first table calculation with all other columns automatically updating.
Step 4: Set up visualisation
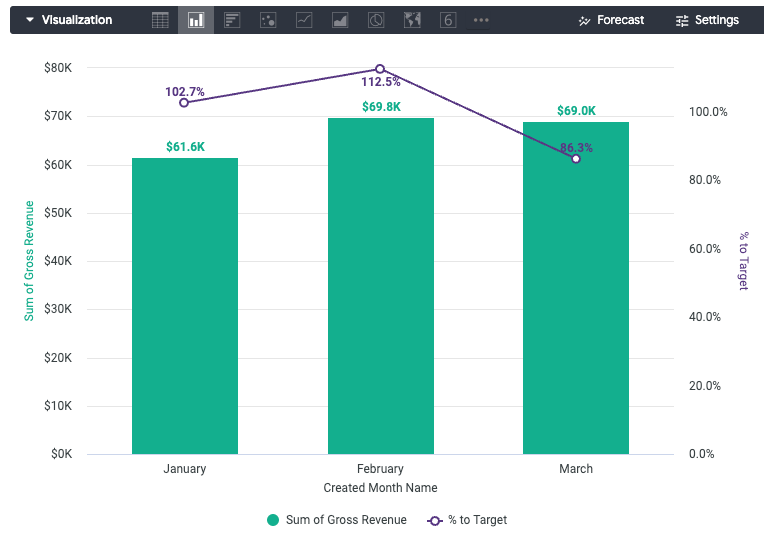
We can now make some impactful visuals to showcase the target tracking we’ve created. As we mentioned above, the intent here is to leverage this foundational look to create multiple visualisations in order to assess your tracking to target in different ways. Perhaps having a monthly bar chart view to compare revenue on the left axis with % of the target on the right axis might be helpful:
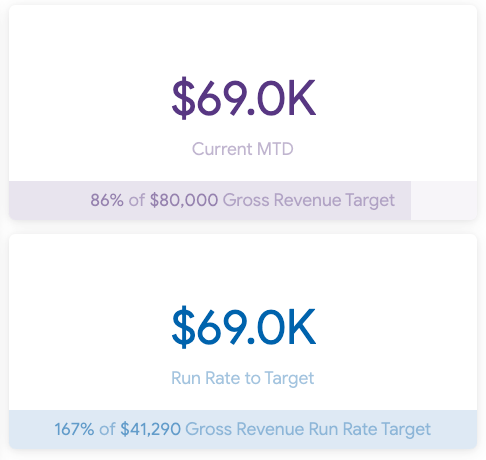
The single value visualisation might be a nice compliment to the above with one tile for total monthly revenue vs target and another showing the daily pacing of the run rate to target. We would achieve this by sorting by the Month Order (descending) and hiding all but the sum_of_gross_revenue measure and the Gross Revenue Target or Run Rate Target calculations respectively. For the comparison, select the ‘Calculate Progress (with Percentage) option in the Single Value visualisation settings:
You could experiment with running totals and narrowing your date range to the current month/integrating a created_date dimension here as well to dig into revenue spikes on particular days of the week or bring in order/customer data to supplement this data as well. Maybe overlaying discounting percentages to daily revenue would be helpful to highlight trends within your business that are driving revenue growth.
Conclusion
While we focused strictly on setting revenue targets through this example, a similar approach could be taken to create looks and tiles that would track any number of relevant company KPIs that you may be looking to assess in order to measure the health of your business. You could keep this high level or go as in-depth as you like — tracking hourly changes, month-over-month comparison against run rate targets, perhaps taking the pacing metric and extrapolating to create a revenue forecast for the month.
Do you want to create powerful dashboards for your business users or take your Business Intelligence and analytics capability to the next level? Have a look at how we created a sophisticated alerting system to monitor KPIs for leading online retailer, MandM Direct, and contact us to discuss a project you have in mind.


